Accidents of Kitchener - Mapping Kitchener's Driving
After I completed my final portfolio, I got really interested and excited about map making. I loved being able to take open data and analyze it, so I decided to give another go at it with QGIS.
QGIS is a free, open-source GIS software which is similar to ArcGIS. You can get QGIS by clicking here. I love the simple interface and how well documented all of its features are, and I would suggest that anyone give QGIS a try. It's a little scary looking at first, but after watching a few tutorials, you can get the hang of it.
Now, I started this project with a few pre-conceived notions. I had seen people in Kitchener drive. I've seen laws that were designed not just to maintain flow of traffic, but to simply keep the driver safe be broken in plain sight and with little regard. So you wouldn't blame me for thinking that there would be a lot of accidents recorded.
However, when I looked at the traffic accident report on the open data site for Kitchener, I found only about 3700 accidents over a 7 year period (2007 - 2014). It was stunning really. For contrast, Toronto has about 2500 collisions in one year (1997 - 1998). That's a little bit strange, if you ask me, so I will be contacting the people responsible for this data just to confirm how this data is gathered and classified. Nevertheless, let's assume this data is true for now.
Another pre-conceived notion I had was that most collisions occur at traffic lights or intersections. It only makes sense: you're not travelling in a straight line, you might swerve while turning, you might not see the driver moving straight through the intersection, and a host of other reasons. So, to find out whether my hypothesis was true, I wanted to use spatial analysis to see the patterns. Now, enough with the preamble, it's time to map!
I fired up QGIS and loaded a base map from Open Street Map. I attached the shape file from the open data site above that contained data for the traffic collisions, as well as shape files for the traffic lights and 4-way stops in Kitchener. I also used another data set just for regional boundaries, but I made them very transparent, so you might not want to bother with the layer like I did. If you're doing this in QGIS, it should look a little like this:
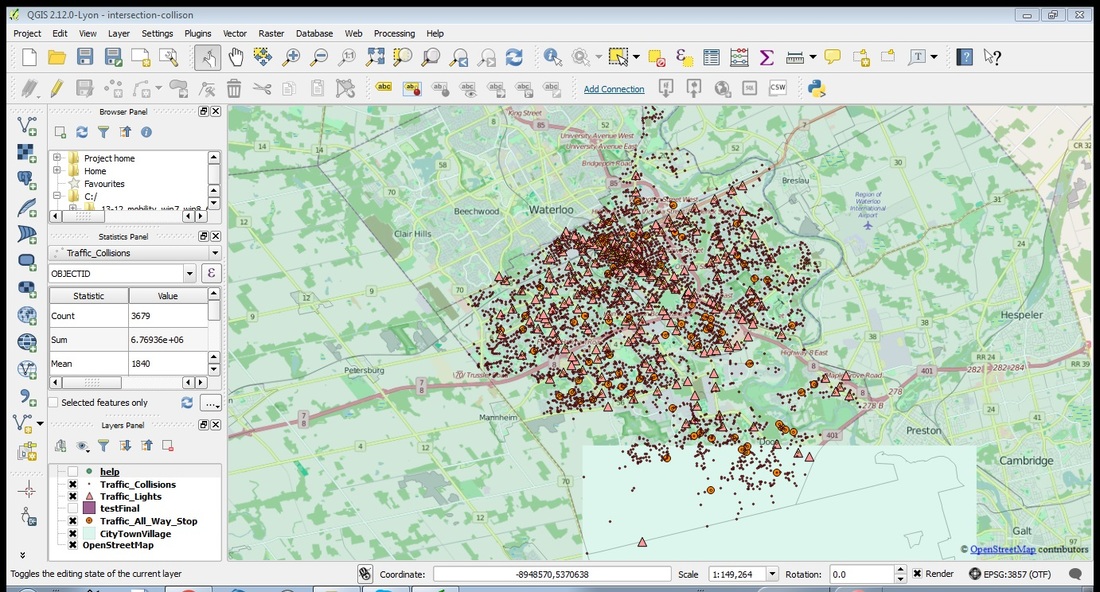
Don't mind the blank square at the bottom, QGIS just needed a little more time to load before I took the screenshot.
Alright, so we have a lot of raw data here. Firstly, I want to make the intersections and traffic lights into one layer, so that way I can make a buffer more easily. I went to Vector -> Geoprocessing Tools -> Union. Then, I used Traffic_Lights and Traffic_All_Way_Stop as my two input layers. I don't think the order that you input them will matter, and you can name them as you wish.
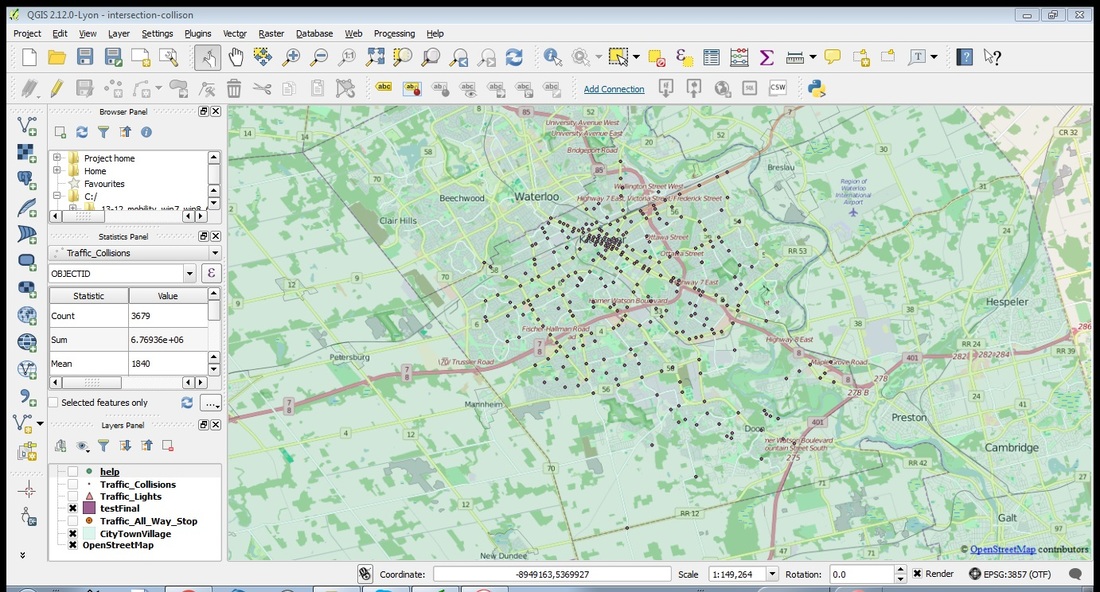
Next, I used Vector -> Geoprocessing Tools -> Buffer to draw a polygon around the new union layer that we created earlier. I used a buffer value of 50. I'm not exactly sure what unit that is, but I believe it might be 50 metres. I named it testFinal, and gave it a nice purple for now. It should look a little like this if you turn off the other vector layers:
Alright, so we have a lot of raw data here. Firstly, I want to make the intersections and traffic lights into one layer, so that way I can make a buffer more easily. I went to Vector -> Geoprocessing Tools -> Union. Then, I used Traffic_Lights and Traffic_All_Way_Stop as my two input layers. I don't think the order that you input them will matter, and you can name them as you wish.
Next, I used Vector -> Geoprocessing Tools -> Buffer to draw a polygon around the new union layer that we created earlier. I used a buffer value of 50. I'm not exactly sure what unit that is, but I believe it might be 50 metres. I named it testFinal, and gave it a nice purple for now. It should look a little like this if you turn off the other vector layers:
Almost done here. Now, we need to find the intersect between the traffic collisions and testFinal. To do that, I went to Vector -> Research Tools -> Select by Location. Then I picked Traffic_Collisions to be the features that are selected, and picked testFinal to be the intersecting layer, and checked every option except Only Selected Features. After pressing OK, you will get every collision sign that is in the 50 metre buffer zone of a traffic light/intersection. After that, I right-clicked on Traffic_Collisions, pressed Save As..., then selected the ESRI Shapefile file type and called the file "help." Make sure to check "Save only selected features." Save your file, make it the only one that's visible, and it should look a little like this:
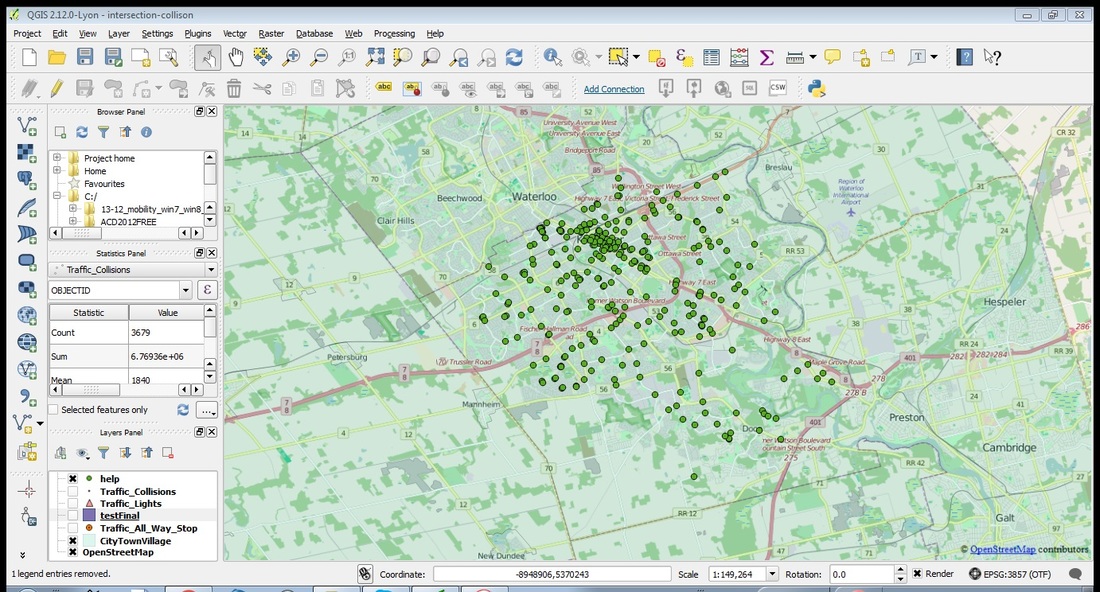
I used the statistics panel to figure out the conclusion. There were 309 points in "help," which was the collisions that occurred within 50 metres of a traffic light/intersection, and 3679 collisions recorded in total. That means that about 8.39 % of traffic collisions occurred near a traffic light or an intersection.
Well, I guess this goes to show us one thing: just how powerful GIS can be. It can show us just how wrong we can be in our pre-conceived notions. Now, we still need to check the validity of the data provided by Kitchener's open data, but this really highlights the perfect nature of GIS when it comes to analyzing data and turning it into information, and later, into conclusions.
I'm going to continue to use QGIS for more spatial analysis. If you have any ideas for a few relations you have in mind (or even a pre-conceived notion like I had), go ahead and send me a message so I can map it.
I've uploaded this map with some important data sets onto CartoDB, which you can explore for yourself.
